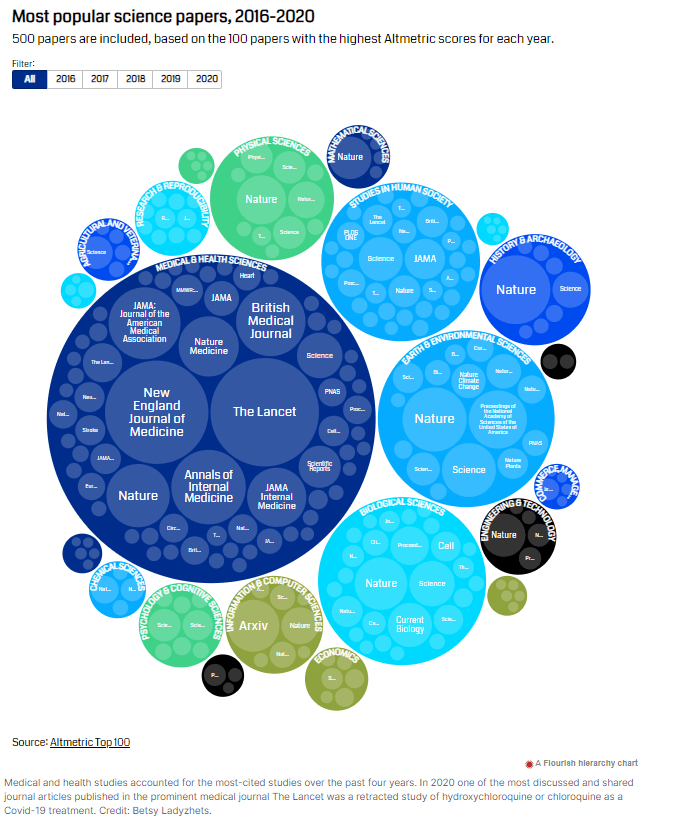
Graphics for Science Literacy Foundation White Paper
Betsy produced data visualizations for the Science Literacy Foundation’s inaugural white paper investigating the state of science literacy, published August 2021.
Betsy produced data visualizations for the Science Literacy Foundation’s inaugural white paper investigating the state of science literacy, published August 2021.

A year ago, engineers built apps to track potential virus exposure. MIT Technology Review investigated how widely these apps were used and what users thought of the technology. This research shows the impact has been mixed—but there’s still potential.

Science News took a look at five universities that opened in the fall. Each school cobbled together testing and other surveillance measures, coupled with uneven rules about wearing masks and public gatherings.
As her final assignment for the Entrepreneurial Journalism Creators Program at the Craig Newmark Graduate School of Journalism at CUNY, Betsy reflected on why she started the COVID-19 Data Dispatch and lessons she learned through the 100-day Creators Program.

More U.S. students are getting science and engineering degrees than ever before. But the gap for Black students in these fields has been stubbornly wide.

Antigen tests are becoming a major tool for rapid COVID-19 testing. But currently, many states are not clearly distinguishing their antigen tests from PCR tests in their public reporting, which makes it challenging to see the true impact of either test type.

To examine how life in America has changed during the COVID-19 pandemic, Stacker used data from the Household Pulse Survey, a U.S. Census survey conducted from April to July 2020 that specifically evaluated how the pandemic impacted Americans’ daily life.
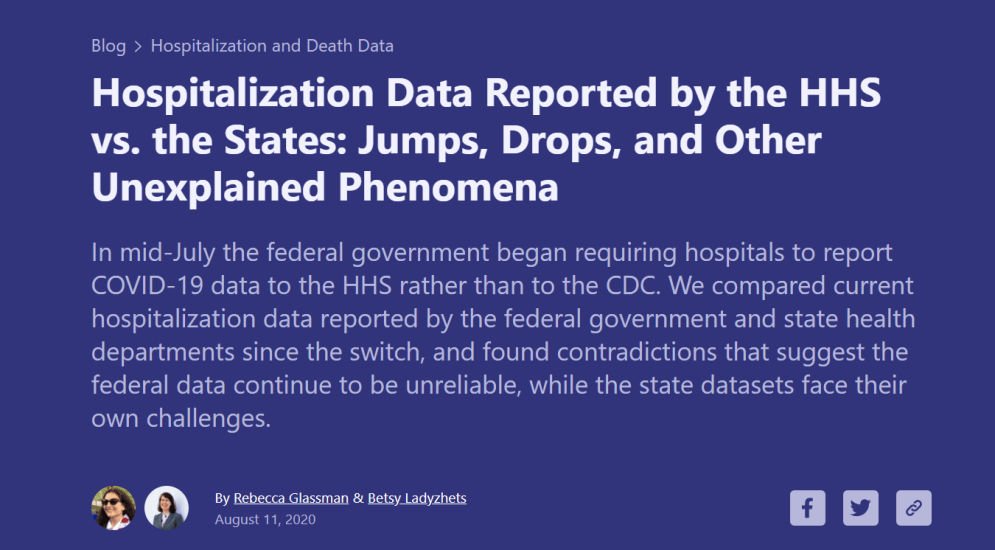
A comparison of hospitalization data reported by the federal government and state health departments finds contradictions that suggest the federal data continue to be unreliable, while the state datasets face their own challenges.

In many ways, all science writers are already data journalists. This reported feature gives science writers background and resources to start reporting on data.

To determine the states with the most endangered species, Stacker consulted the U.S. Fish & Wildlife Service’s Endangered Species database. States are ranked according to the total number of species (animals and plants) with endangered or threatened classifications that live within their borders.
